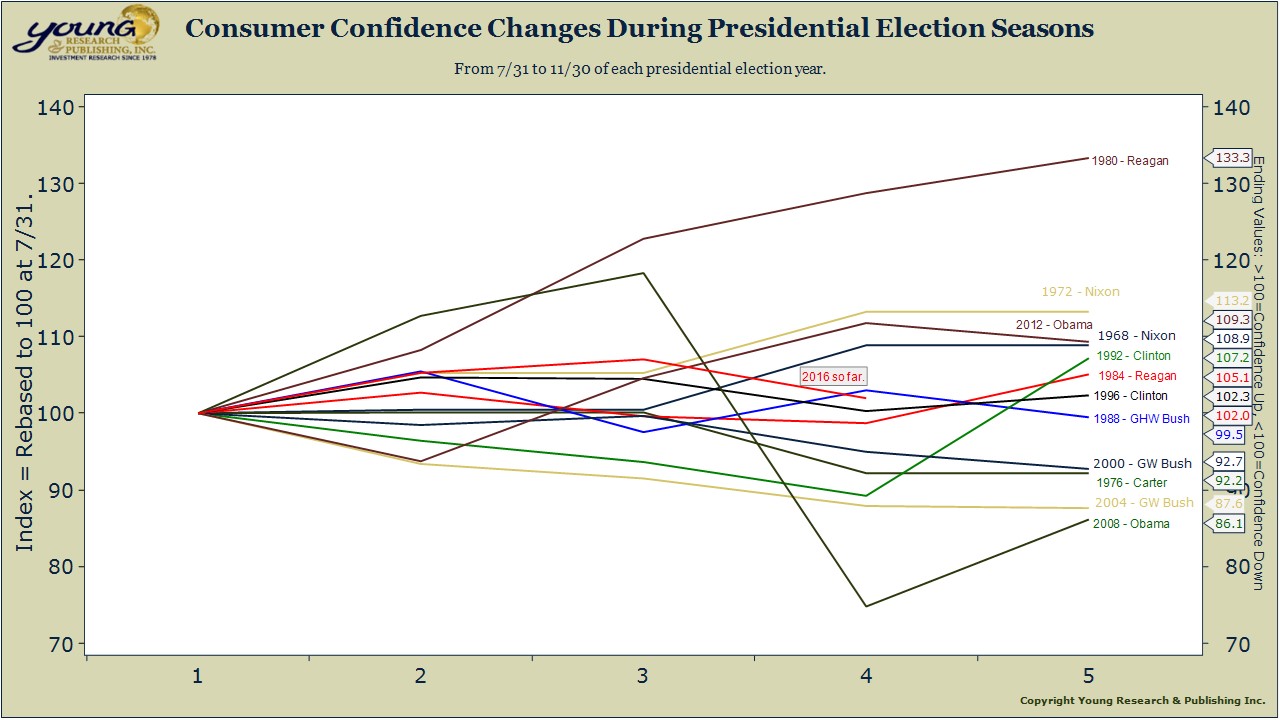
From the end of July, through the end of November, consumers are barraged by negative campaigning and big promises. Take a look at the chart below to see how their confidence was affected by each campaign cycle. Ending values greater than 100 indicate an improvement in confidence, and values below 100 indicate a decline in confidence.