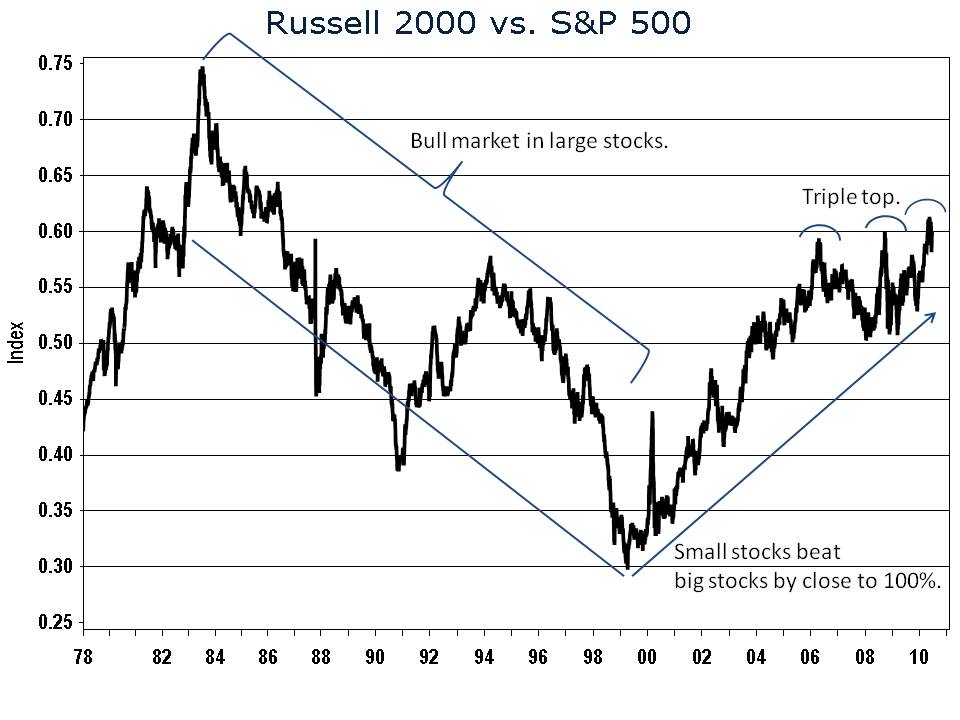
Is the strength in small-cap stocks running out of steam? I’m not talking about the recent correction in small stocks, but rather the relative performance of small cap stocks versus large cap stocks over the past decade. My chart shows the ratio of small stocks as measured by the Russell 2000 index to large stocks as measured by the S&P 500. When the ratio is climbing, small stocks are outperforming large stocks, and when the reverse is true large stocks are outperforming. You can see clearly from the chart that the decade of the 1980s and 1990s was a period when large-cap stocks were in favor. There were a few years in the first half of the 1990s when small stocks were in favor, but small stocks lost upside momentum in the mid-1990s and fell sharply during the technology bubble of the late 1990s. After hitting a low in relative terms in early 1999, small stocks crushed large stocks by close to 100% over the ensuing seven years. Since then, small stocks have run into fierce resistance around 0.60 on my relative strength chart. A triple top has formed.
Small-cap stocks are much more reliant on the strength of the U.S. economy than large stocks. Given the high probability that U.S. economic growth will lag global economic growth over coming years, small stocks may be due for a period of relative weakness.


