The chart below compares the spread (yield difference with treasuries) of the Merrill Lynch High-Yield Master Index to the S&P 500. The vertical axis for the Merrill Lynch spread is reversed to show falling spreads as rising (a positive). High-yield spreads and stock prices tend to move in lock-step, but tops and bottoms in spreads tend to lead tops and bottoms in stocks.
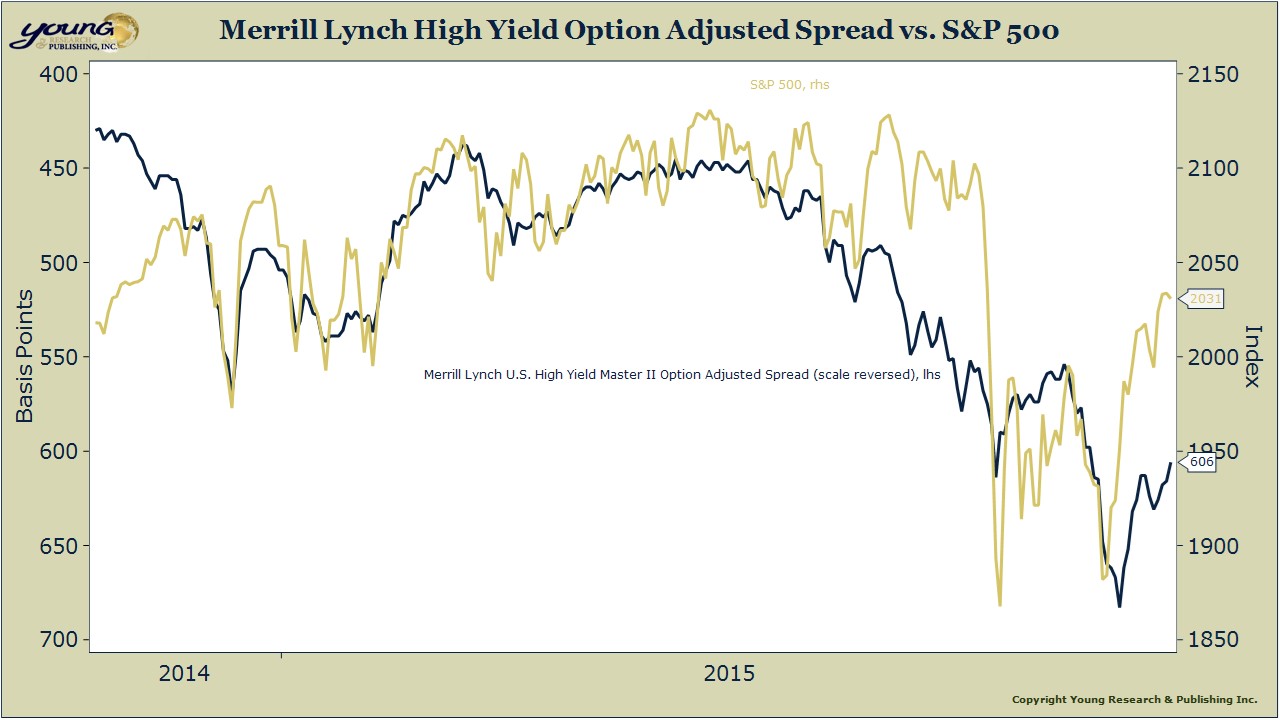
The recent rally in the S&P 500 has not been confirmed by the performance in high-yield bonds. High yield bonds hit a lower low in September and their rally has now only brought spreads back to the level reached on August 24th when the S&P 500 hit its low for the year.
High-yield bond investors aren’t nearly as confident as stock market investors that the all-clear signal has been given. The bottom line is that before we can be confident in the sustainability of the stock market rally, we’ll have to see some catching up from high-yield bonds.


