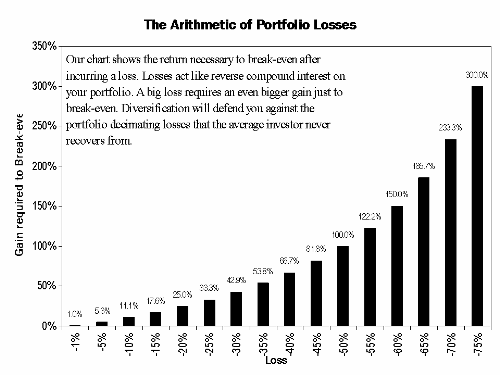
A basic understanding of the arithmetic of portfolio losses can help you become a more comfortable confident investor. Our chart of the arithmetic of portfolio losses shows investors what returns they’ll need to make up for portfolio losses. The horizontal axis shows the assumed portfolio loss incurred. The vertical axis shows the portfolio gain required to break even.
The bigger the loss your portfolio incurs, the harder it is to recover. Conversely, recovery is less difficult when facing a small loss. If your portfolio drops 10%, you need a gain of only 11.1% to break even. But if your portfolio drops by 50%, you need a gain of 100% to break even. And if you suffer a loss of 70%, you need a staggering 233% return to break even—which could take decades.
Pursuing high returns with overly aggressive investment strategies left many investors with major losses when the financial crisis hit. The S&P 500 dropped 56% from peak to trough—a loss that requires a 127.3% gain just to break even. Even the lucky investors who have managed to recover from a 56% loss endured whipsaw volatility. Most retired investors have neither the willingness nor the ability to endure massive swings in portfolio value.
If you are in or nearing retirement, a 56% portfolio loss is unacceptable. It could be years before you recover from such substantial losses. To reduce volatility and to avoid devastating bear market losses, we have long advised a balanced approach. Today we favor a 60/30/10 allocation in fixed income, equities and gold and currencies respectively.
Note: The formula to calculate the gain required to recover from a specified loss is as follows:
((1/(1-percent loss))-1)*100.


