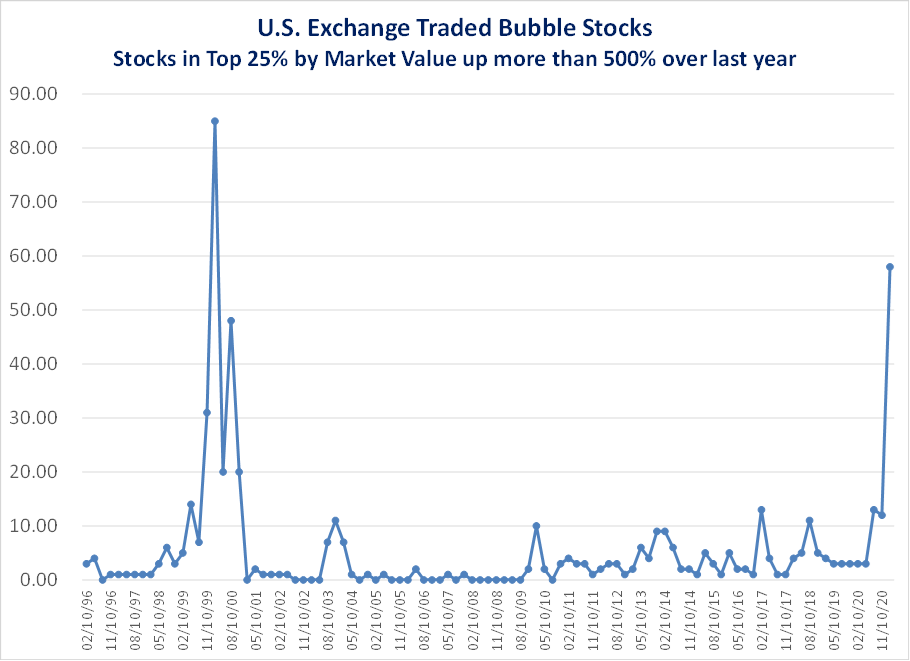
This chart doesn’t require much explanation. What you are looking at is the number of stocks listed on U.S. exchanges with meaningful market values that are up more than 500% over the last year.
Why 500% over a year? It is admittedly pretty arbitrary, but a nice round number that is so high it would be difficult to explain as something justified by improving fundamentals.
The last time we saw anything close to this kind of mania was the dot-com bubble. Seasoned investors have the benefit of knowing how this type of mania ends. Stay cautious and prudent even if your neighbor’s basement-dwelling son is boasting about YOLOing his way to financial freedom.