Mort Zuckerman’s editorial in The Wall Street Journal outlines the feeble jobs recovery in America. Americans are facing fewer hours, lower pay, and less work in general after the financial crisis.
The jobless nature of the recovery is particularly unsettling. In June, the government’s Household Survey reported that since the start of the year, the number of people with jobs increased by 753,000—but there are jobs and then there are “jobs.” No fewer than 557,000 of these positions were only part-time. The survey also reported that in June full-time jobs declined by 240,000, while part-time jobs soared by 360,000 and have now reached an all-time high of 28,059,000—three million more part-time positions than when the recession began at the end of 2007.
That’s just for starters. The survey includes part-time workers who want full-time work but can’t get it, as well as those who want to work but have stopped looking. That puts the real unemployment rate for June at 14.3%, up from 13.8% in May.
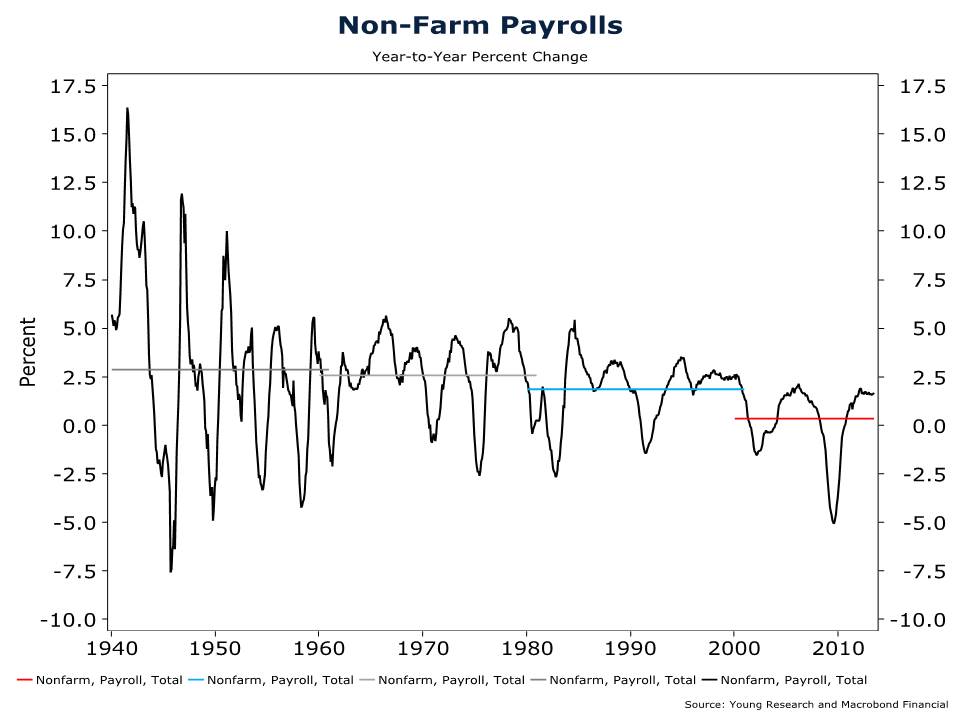
Take a look at the chart below and you’ll see that as time goes by, the rate of job growth lessens. From 1940 to 1960 average year over year job growth is 2.9%. That includes years with terrible job losses like 1945, 1949, 1954 and 1958. Those years saw job declines nearly as bad or worse than 2009, but the dynamic free market economy was able to generate job growth of nearly 12% in 1946, 10% in 1951, 5.1% in 1956, and 5.5% in 1959. This is the post-WWII golden era of the U.S. economy.
From 1960 to 1980 job growth remains a strong 2.6% on average, with the 60s rarely seeing job losses, with mild declines only from December 1960 to July 1961. The 1970s began to hurt as job losses were more frequent and deep with slower job gains to offset them. The 1980s and 90s saw job growth drop to 1.85% on average. That was supposed to be the unending era of prosperity. After 2000, job growth has averaged a meager 0.34% per year. That’s much less than the rate at which population has been growing, 0.91%. Of course, population growth was higher in earlier decades, and that has a positive effect on growth. And in the 40s through the 80s workforce participation was generally increasing, while now it is declining. Whether or not population growth and workforce participation growth cause economic growth or can be attributed to it remains a topic of debate.
Zuckerman goes on to explain just how unprecedented this slow growth is.
These businesses’ hesitation to hire is part of a larger caution among employers unsure about the direction of government policy—and which has helped contribute to chronic long-term unemployment that shows no sign of easing. Unlike those who lose a job and then find another one in a matter of weeks or months, fully a third of the currently unemployed have been out of work for more than six months. As they remain out of the workforce, their skills deteriorating, the likelihood rises that they will be seen as permanently unemployable. With each passing month of bleak job news, the possibility increases of a structural unemployment problem in the U.S. such as Europe experienced in the 1980s.
That brings us to a stunning fact about the jobless recovery: The measure of those adults who can work and have jobs, known as the civilian workforce-participation rate, is currently 63.5%—a drop of 2.2% since the recession ended. Such a decline amid a supposedly expanding economy has never happened after previous recessions. Another statistic that underscores why this is such a dysfunctional labor market is that the number of people leaving the workforce during this economic recovery has actually outpaced the number of people finding a new job by a factor of nearly three.
Without a major turnaround, it’s hard to see how America avoids another recession.

