The S&P 500 gained more than 1% for the fifth consecutive time last week as the Fed decided to rip up its statutory mandate and go with its gut on policy.
Five consecutive 1%+ gains in the S&P 500 is a rare occurrence in stock market history. Over the last 70 years, this has only happened on 12 other occasions (14 if you count the episodes when it happened in back to back weeks). The last time this happened was in the early weeks of the current bull market.
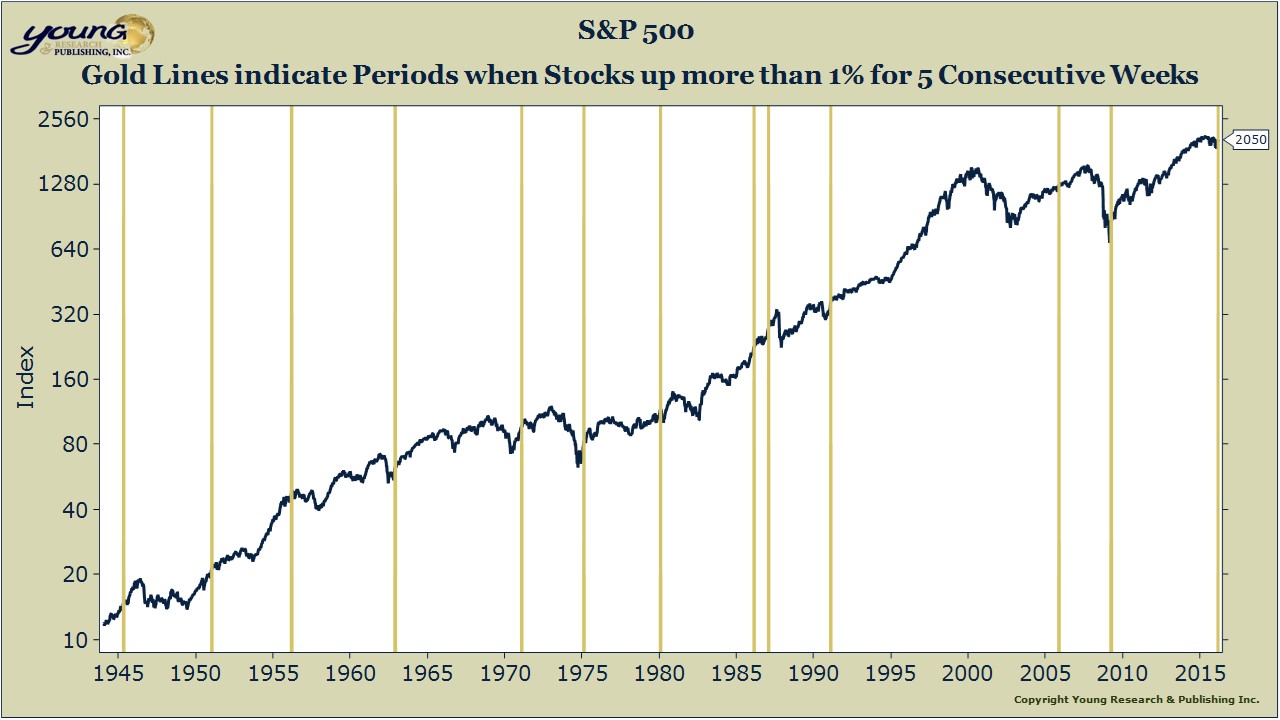
How have stocks performed following a period of five weekly gains of 1% or more? Our chart shows the performance of the S&P 500 following these price bursts which are signaled by the gold vertical lines on the chart. Most often, the market is up in the 12 months following one of these price bursts—sometimes big.
Is that a green light to speculate in stocks? Not at all. We are living in a brave new world of unprecedented monetary intervention. The central banks of the world have united in coordinated fashion to manipulate markets and encourage the mispricing and misallocation of capital in an attempt to achieve arbitrary inflation levels.
With the central banks playing such a dominate role in financial markets, one can no longer rely solely on the economic fundamentals as a guide to likely investment performance. The ebb and flow of global liquidity is as, if not more important, than the performance of the real economy. And if the Fed can completely change its policy over the course of a couple of weeks as it did last week, what’s to stop them from reversing that move a few weeks or months down the road?


