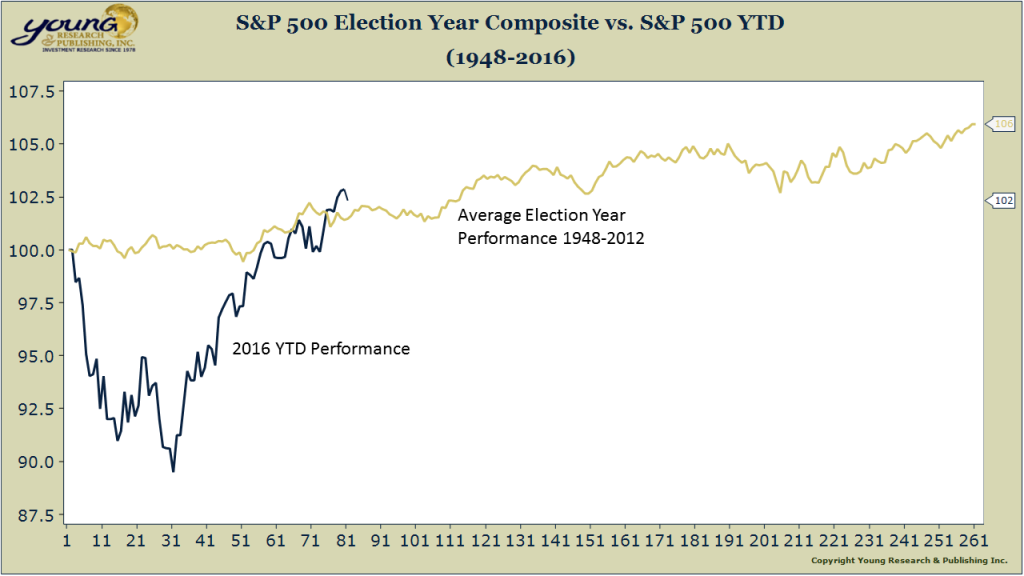
The chart below shows the average performance of the S&P 500 (not including dividends) during all Presidential Election Years from 1948-2012 along with the YTD performance of the S&P 500. The horizontal scale is trading days from December 31. After a big correction to start the year, stocks are back on track with their historical Election Year performance.
Jeremy Jones, CFA, CFP® is the Director of Research at Young Research & Publishing Inc., and the Chief Investment Officer at Richard C. Young & Co., Ltd. CNBC has ranked Richard C. Young & Co., Ltd. as one of the Top 100 Financial Advisors in the nation (2019-2022) Disclosure. Jeremy is also a contributing editor of youngresearch.com.
Latest posts by Jeremy Jones, CFA (see all)
- Money Market Assets Hit Record High: $5.4 Trillion - May 26, 2023
- The Mania in AI Stocks Has Arrived - May 25, 2023
- The Wisdom of Sam Zell - May 24, 2023