Janet Yellen gave a speech yesterday at UMass Amherst titled Inflation Dynamics and Monetary Policy. Yellen was a bit more hawkish on monetary policy than she was during the press conference following the Fed’s latest meeting. The market is taking Yellen’s more hawkish tone as a sign that the global economy may not lead the U.S. into a depression after all. Good is good for asset prices again? Hallelujah to that. Or was it this report, by a JP Morgan derivatives analyst who became a rock star in the minds of many on Wall Street for his prescient calls on the market over the last month? The rally did start mid-day yesterday just as this analyst’s report was released.
Onto the speech. There are many bones to pick with Yellen’s speech. Her explanation of the risks of deflation seems to ignore a few hundred years of history in the U.S. and U.K when deflation reigned supreme and economic growth was robust. The Fed’s moving of the goal posts on their full employment target over and over again to justify today’s monetary policy is also a huge no-no, but Yellen & Co., don’t seem to recognize the risk. Those are the negatives. What are the positives?
To Yellen’s credit, the speech provided a clear and concise explanation of how the Fed thinks about monetary policy. If you want insight into how the Fed is likely to change monetary policy, as opposed to how they should change monetary policy (something you can read more than you’d care to on this site), than Yellen’s speech last night is a good primer.
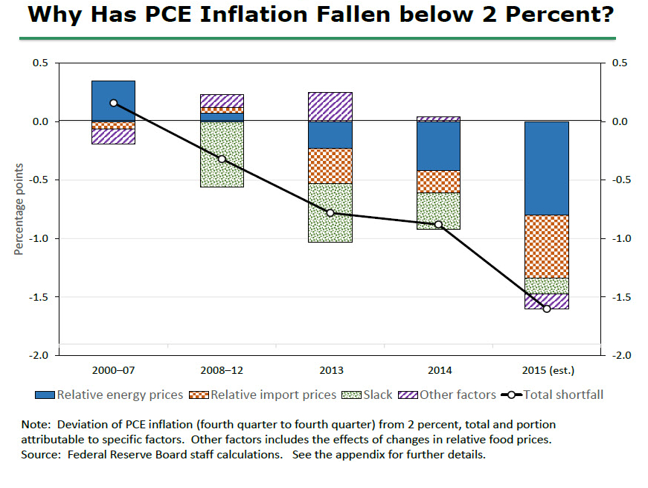
I especially like the chart she used to beat back the keep-rates-at-zero-forever crowd because measured inflation is currently low. See the chart below. Yellen’s chart decomposes the sources of the difference between the Fed’s 2% inflation target and the current rate of inflation. As you can see for 2015 the vast majority of the inflation miss can be explained by falling energy and import prices. Import prices are heavily influenced by foreign exchange rates. Neither factor should be expected to persist long-term. Strip away those two factors and inflation is already much closer to the Fed’s target.
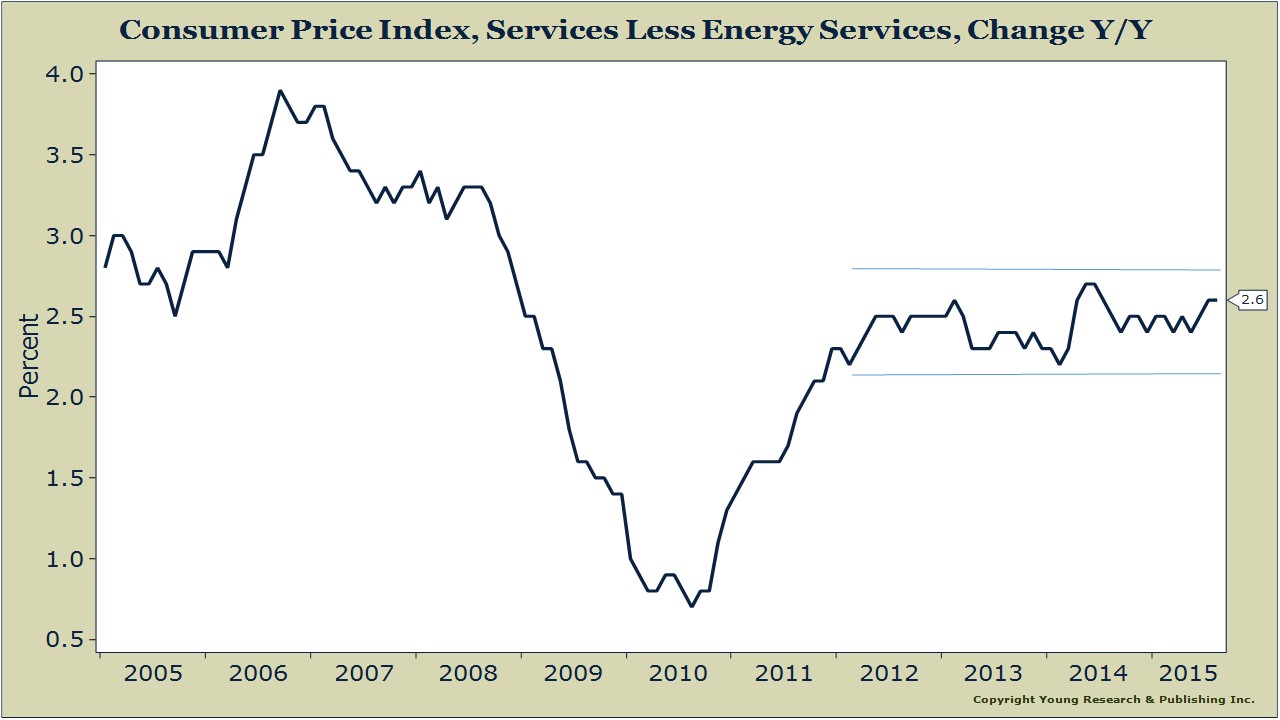
You can short-hand Yellen’s method to strip away the impact of a stronger dollar and lower oil prices by looking at services inflation excluding energy services. As our chart shows, services inflation has been running at a stable 2.0-2.5% since 2012.