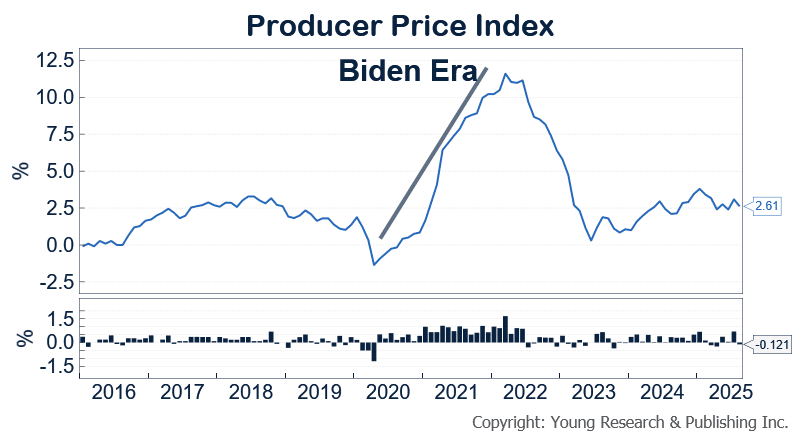
The US Bureau of Labor Statistics reported that in August, the Producer Price Index (PPI) for final demand edged down 0.1%, following a 0.7% rise in July, with an annual increase of 2.6%. The decrease was largely due to a 0.2% drop in service prices, while goods prices rose by 0.1%. Economists surveyed by Bloomberg had expected increases in PPI of 0.3% month-over-month and 3.3% year-over-year. BLS writes:
The Producer Price Index for final demand edged down 0.1 percent in August, seasonally adjusted, the U.S. Bureau of Labor Statistics reported today. Final demand prices advanced 0.7 percent in July and 0.1 percent in June. On an unadjusted basis, the index for final demand rose 2.6 percent for the 12 months ended in August. The August decrease in the final demand index is attributable to a 0.2-percent decline in prices for final demand services. In contrast, the index for final demand goods inched up 0.1 percent. Prices for final demand less foods, energy, and trade services rose 0.3 percent in August, the fourth consecutive increase. For the 12 months ended in August, the index for final demand less foods, energy, and trade services moved up 2.8 percent, the largest 12-month advance since climbing 3.5 percent in March 2025.
Final demand services: The index for final demand services fell 0.2 percent in August, the largest decline since moving down 0.3 percent in April. The August decrease can be traced to a 1.7-percent drop in margins for final demand trade services. Conversely, the indexes for final demand services less trade, transportation, and warehousing and for final demand transportation and warehousing services increased, 0.3 percent and 0.9 percent, respectively. Three-quarters of the August decrease in prices for final demand services can be attributed to a 3.9-percent decline in margins for machinery and vehicle wholesaling. The indexes for professional and commercial equipment wholesaling, chemicals and allied products wholesaling, furniture retailing, food and alcohol retailing, and data processing and related services also moved lower. In contrast, prices for portfolio management advanced 2.0 percent. The indexes for truck transportation of freight and for apparel wholesaling also increased.
Final demand goods: Prices for final demand goods inched up 0.1 percent in August, the fourth consecutive advance. Leading the August increase in the index for final demand goods, prices for final demand goods less foods and energy rose 0.3 percent. The index for final demand foods moved up 0.1 percent. Conversely, prices for final demand energy declined 0.4 percent. A major factor in the August increase in the index for final demand goods was a 2.3-percent advance in prices for tobacco products. The indexes for beef and veal, processed poultry, printed circuit assemblies, boards, modules, and modems, and electric power also rose. In contrast, prices for utility natural gas decreased 1.8 percent. The indexes for fresh and dry vegetables, chicken eggs, and copper base scrap also fell.
Intermediate Demand by Commodity Type: Within intermediate demand in August, the index for processed goods rose 0.4 percent, prices for unprocessed goods fell 1.1 percent, and the index for services increased 0.3 percent. Prices for processed goods for intermediate demand moved up 0.4 percent in August, the fifth consecutive increase. Over 80 percent of the August advance can be attributed to the index for processed materials less foods and energy, which rose 0.4 percent. Prices for processed foods and feeds moved up 1.0 percent. Conversely, the index for processed energy goods declined 0.1 percent. For the 12 months ended in August, prices for processed goods for intermediate demand moved up 2.6 percent, the largest 12-month rise since increasing 3.9 percent in January 2023. A major factor in the August increase in the index for processed goods for intermediate demand was a 5.5-percent jump in prices for aluminum mill shapes.
Prices for unprocessed goods for intermediate demand declined 1.1 percent in August following a 2.3-percent rise in July. Over three-quarters of the broad-based decrease is attributable to the index for unprocessed energy materials, which dropped 2.5 percent. Prices for unprocessed nonfood materials less energy and for unprocessed foodstuffs and feedstuffs also moved lower, 0.5 percent and 0.3 percent, respectively. For the 12 months ended in August, the index for unprocessed goods for intermediate demand rose 3.0 percent, the largest 12-month increase since advancing 6.5 percent in March. Sixty percent of the August decline in prices for unprocessed goods for intermediate demand can be traced to the index for crude petroleum, which fell 2.8 percent. Prices for grains, ungraded chicken eggs, natural gas, raw milk, and copper base scrap also decreased. Conversely, the index for hay, hayseeds, and oilseeds jumped 6.1 percent. Prices for slaughter cattle and for iron and steel also increased.
Intermediate Demand by Production Flow: Prices for stage 4 intermediate demand advanced 0.5 percent in August, the eleventh consecutive increase. In August, the index for total services inputs to stage 4 intermediate demand rose 0.6 percent, and prices for total goods inputs moved up 0.4 percent. Advances in the indexes for nonresidential real estate services, machinery and equipment parts and supplies wholesaling, portfolio management, co-employment staffing services, fabricated structural metal products, and printed circuit assemblies, boards, modules, and modems outweighed declines in the indexes for chemicals and allied products wholesaling, grains, and particleboard and fiberboard. For the 12 months ended in August, prices for stage 4 intermediate demand moved up 3.1 percent, the largest 12-month increase since rising 3.4 percent in March 2023.
The index for stage 3 intermediate demand increased 0.2 percent in August after advancing 1.1 percent in July. In August, prices for total services inputs to stage 3 intermediate demand rose 0.3 percent, and the index for total goods inputs edged up 0.1 percent. Increasing prices for co-employment staffing services, nonresidential real estate services, slaughter hogs, slaughter cattle, printed circuit assemblies, boards, modules, and modems, and diesel fuel outweighed decreases in the indexes for ungraded chicken eggs, grains, and chemicals and allied products wholesaling. For the 12 months ended in August, prices for stage 3 intermediate demand moved up 2.5 percent, the largest 12-month advance since rising 3.9 percent in January 2023.
Prices for stage 2 intermediate demand declined 0.2 percent in August, the first decrease since falling 0.7 percent in May. In August, the index for total goods inputs to stage 2 intermediate demand moved down 0.7 percent. In contrast, prices for total services inputs rose 0.1 percent. Declines in the indexes for crude petroleum, gas fuels, broadcast and network advertising time sales, chemicals and allied products wholesaling, primary basic organic chemicals, and copper base scrap outweighed increasing prices for co-employment staffing services, oilseeds, and loan services (partial). For the 12 months ended in August, the index for stage 2 intermediate demand moved up 0.6 percent.
Prices for stage 1 intermediate demand moved up 0.2 percent in August following a 1.0-percent increase in July. In August, the indexes for total services inputs and for total goods inputs to stage 1 intermediate demand both advanced 0.2 percent. Rising prices for nonresidential real estate services, diesel fuel, portfolio management, agricultural chemicals and chemical products, inedible fats and oils, and printed circuit assemblies, boards, modules, and modems outweighed decreases in the indexes for data processing and related services, chemicals and allied products wholesaling, and grains. For the 12 months ended in August, prices for stage 1 intermediate demand moved up 2.4 percent, the largest 12-month advance since increasing 3.8 percent in February 2023.
Read more here.

