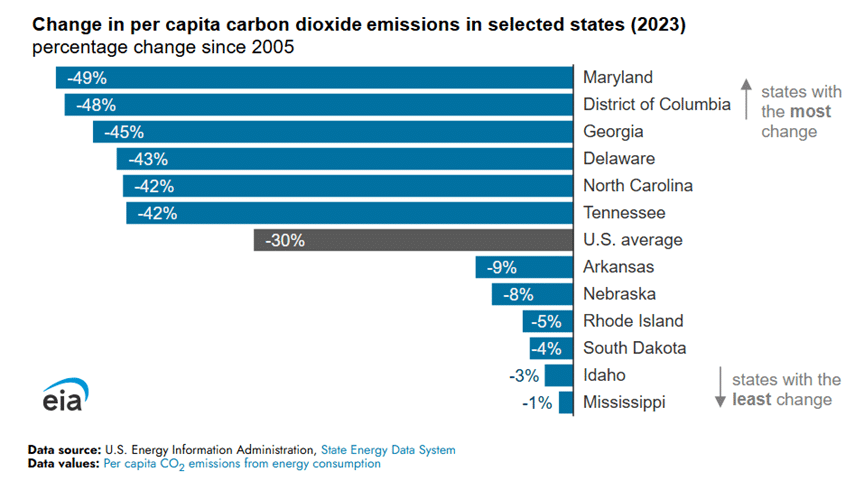
The US Energy Information Administration reports that from 2005 to 2023, per capita CO2 emissions from primary energy consumption fell in every US state, driven largely by a shift away from coal in the electric power sector toward cleaner energy sources like natural gas, wind, and solar. Nationwide, total energy-related CO2 emissions dropped 20% while the population grew 14%, resulting in a 30% decline per person. Maryland led the nation with a 49% per capita reduction. By 2023, the transportation sector had become the largest source of CO2 emissions in most states, overtaking the power sector due to continued coal retirements and steady transportation fuel use. They write:
Per capita CO2 emissions from primary energy consumption decreased in every state from 2005 to 2023, according to recently released data in our State Energy Data System. Total energy-related CO2 emissions in the United States fell 20% over that time, and the population grew by 14%, leading to a 30% decrease in per capita CO2 emissions.
CO2 emissions across the country primarily declined because less coal was burned in the electric power sector. Increased electricity generation from natural gas, which releases about half as many CO2 emissions per unit of energy when combusted as coal, and from non-CO2-emitting wind and solar generation offset the decrease in coal generation. Looking ahead, our Short-Term Energy Outlook forecasts a slight 1% increase in U.S. total CO2 emissions in 2025, in part because of more recent increased fossil fuel consumption for crude oil production and electricity generation growth.
Our state energy-related CO2 data represent emissions from primary energy consumption of fossil fuels (petroleum, natural gas, and coal) for all sectors. We count CO2 emissions released at power plants in the state where they are located, even if the electricity generated is sent across the grid for use in other states or countries. Similarly, we account for transportation CO2 emissions in the state where fuels are sold to end users, even if the vehicles, boats, or planes later travel across state or international lines.
Maryland led all states with a 49% reduction in per capita CO2 emissions from energy consumption between 2005 and 2023, as the state’s total CO2 emissions fell 43% and population grew 11%. In 2023, Maryland had the lowest per capita CO2 emissions of any state, at 7.8 metric tons of CO2 (mtCO2), which is the second lowest in recorded data beginning in 1960. The District of Columbia has lower per capita CO2 emissions than any state and tied its record low of 3.6 mtCO2 in 2023.
In Maryland, coal and natural gas accounted for 56% and 4%, respectively, of in-state electricity generation in 2005, but coal and natural gas shares nearly reversed to 5% and 41%, respectively, in 2023. During the same period, new solar and wind generation came online, and the combined generation mix shift resulted in a 74% reduction in Maryland’s total electric power sector CO2 emissions. Similar coal retirement and replacement trends occurred in each of the states with the largest reductions in per capita CO2 emissions from 2005 to 2023.
Sector emissions
In 2023, the transportation sector accounted for the largest share of CO2 emissions from energy consumption in 28 states. For 14 of those 28 states, the transportation sector overtook the electric power sector after 2005, largely because of decreased coal use for electric power and relatively flat petroleum use for transportation. In 2005, the electric power sector accounted for the largest share of emissions in 31 states, while the transportation sector made up the largest share of emissions in 17 states.
The transportation sector had the most CO2 emissions in almost all states along the east and west coasts of the contiguous United States in 2023. These states are generally more densely populated and have more road and air travel. Many of these coastal states also do not consume coal for electricity generation anymore, meaning electric power sector CO2 emissions have declined since 2005.
In 2023, the electric power sector was the leading source of CO2 emissions in 18 states. Most of these states, such as Pennsylvania, Alabama, and Wyoming, are net electricity suppliers to other states. Many of these states also generate a large share of their electricity from coal. West Virginia, Wyoming, Kentucky, Missouri, and North Dakota each generated over half of their in-state electricity from coal in 2023.
The industrial sector, which includes manufacturing and agriculture, accounted for the largest share of CO2 emissions in four states in 2023. Large oil, natural gas, and refining industries in Texas, Louisiana, and Alaska and large agriculture and biofuels production industries in Iowa contribute to higher industrial emissions in these states. U.S. industrial sector CO2 emissions are concentrated in a handful of states. The five states with the highest industrial CO2 emissions accounted for over half of the U.S. total in 2023.
Nationwide, the electric power sector accounted for the largest share of CO2 emissions in the United States until 2016, when the transportation sector surpassed it. U.S. total CO2 emissions peaked for both the electric power and transportation sectors in 2007. CO2 emissions in the electric power sector have declined faster than in the transportation sector since 2007 because the electricity generation fuel mix has shifted away from coal and toward natural gas, wind, and solar. Since 2007, the transportation fuel mix has remained relatively steady despite increased electric vehicle sales and less petroleum transportation fuel demand since the COVID-19 pandemic.