![]()
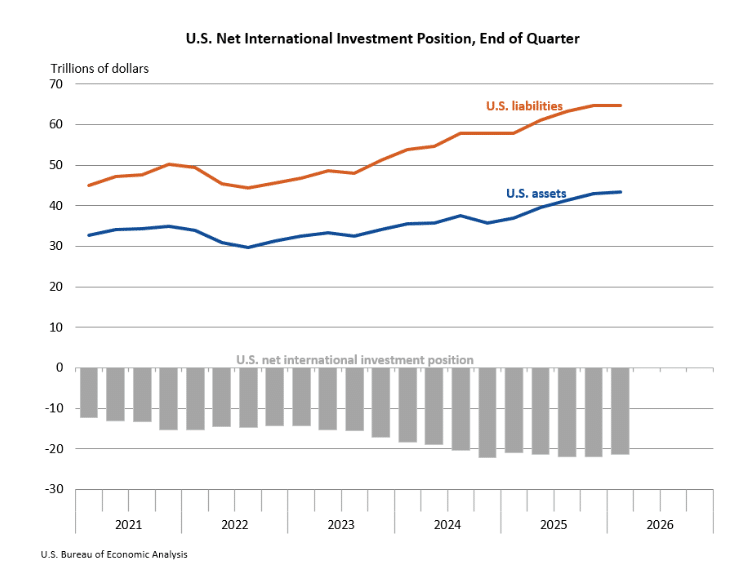
The financial account showed net US borrowing of $209 billion, with foreign liabilities rising faster than U.S. foreign assets. Despite this, the net international investment position improved to –$21.27 trillion from –$21.87 trillion, driven largely by valuation changes and financial transactions.
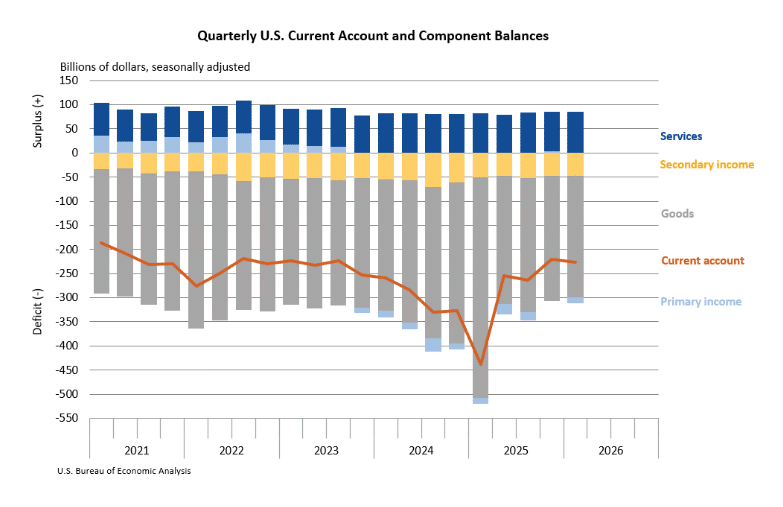
Overall, the data highlight continued widening trade imbalances alongside significant cross-border financial flows, with higher imports and stronger foreign investment in US assets shaping the external accounts.
|
Updates for the Fourth Quarter of 2025 International Transactions Accounts Balances |
||
|---|---|---|
| Preliminary estimates | Revised estimates | |
| Billions of dollars, seasonally adjusted | ||
| Current-account balance | –190.7 | –221.1 |
| Goods balance | –241.5 | –259.4 |
| Services balance | 81.4 | 82.1 |
| Primary income balance | 23.9 | 3.4 |
| Secondary income balance | –54.6 | –47.2 |
| Net financial-account transactions | –135.9 | –248.7 |
| International Investment Position Aggregates | ||
|---|---|---|
| Preliminary estimates | Revised estimates | |
| Trillions of dollars, not seasonally adjusted | ||
| U.S. net international investment position | –27.54 | –21.87 |
| U.S. assets | 42.96 | 42.91 |
| U.S. liabilities | 70.49 | 64.78 |
| U.S. Bureau of Economic Analysis | ||


