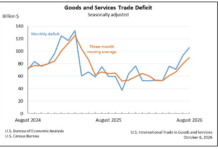

The U.S. goods and services trade deficit widened by $17.4 billion, or 24.4%, to $88.6 billion in July, as imports increased while exports declined. Exports fell 2.1% to $310.7 billion, while imports rose 2.8% to $399.3 billion. The increase was driven primarily by a $17.6 billion rise in the goods deficit, which reached $119.6 billion.
| Deficit: | $88.6 Billion | +24.4%° |
| Exports: | $310.7 Billion | –2.1%° |
| Imports: | $399.3 Billion | +2.8%° |
| Next release: Tuesday, October 6, 2026
(°) Statistical significance is not applicable or not measurable. Data adjusted for seasonality but not price changes Source: U.S. Census Bureau, U.S. Bureau of Economic Analysis; U.S. International Trade in Goods and Services, September 3, 2026 |
||
Imports of goods increased by $11.4 billion, led by a $14.4 billion jump in capital goods, including computers, computer accessories and semiconductors. Goods exports declined by $6.2 billion, largely due to lower shipments of industrial supplies, crude oil and nonmonetary gold. Despite the July increase, the year-to-date trade deficit was down 29.6% from the same period in 2025, with exports up 12.0% and imports up 1.9%.
The largest July goods deficits were with Mexico ($27.5 billion), Vietnam ($23.3 billion), Taiwan ($18.1 billion) and China ($15.2 billion). The deficit with Mexico increased by $7.2 billion, while the deficit with Canada narrowed by $3.7 billion.