The S&P 500 sold off sharply yesterday breaking through a key technical level (its 200-day moving average) and falling back into correction territory—a decline of 10% or more from its prior high. Ten percent corrections are not uncommon. We see about one 10% correction per year. On average, corrections last for about four months. This correction is about two and half months old.
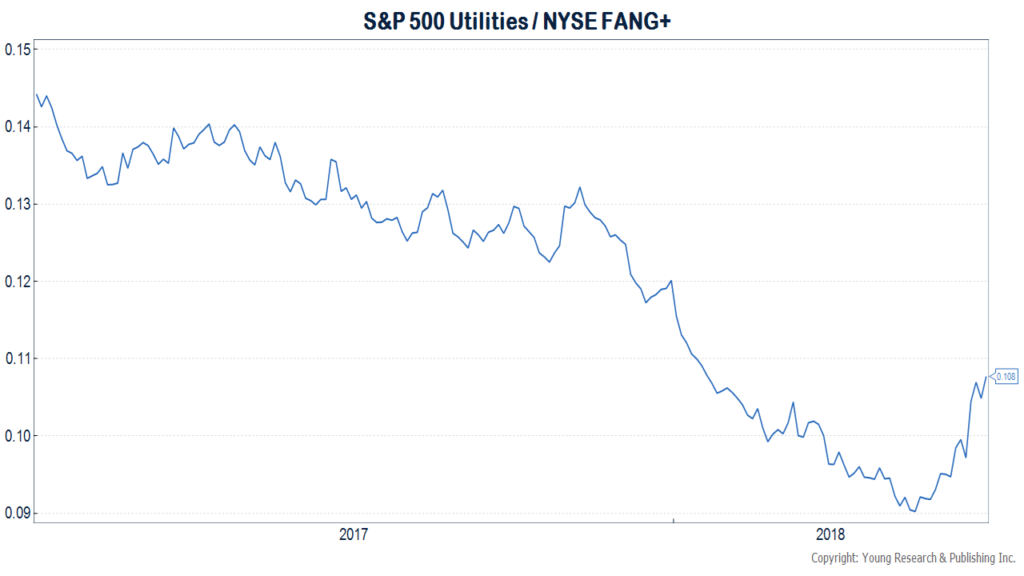
Stocks were lower on an intra-day basis during the initial stages of the correction in February, but yesterday was the lowest closing price this year. More interesting than the performance of the overall market, is the performance of the market leaders in this most recent down leg. The highly prized and priced FAANG stocks held up relatively well during the initial stages of the correction, rebounding quickly and hitting new highs in March when the rest of the market lagged. But since its March 12th high, the NYSE FANG+ index is down more than 14%. Compare that to the S&P 500 Utilities index which is up over the last month.
Who was buying Utility stocks in March? We hope you. We advised in a March 1st post that rich valuations in the FAANG stocks were creating opportunities in the RUST sectors (Real Estate, Utilities, Staples, Telecom) of the market.
An investor who went short the NYSE FANG+ index on March 1st and long any one of the RUST sectors of the market would be sitting on gains today. A long position in the Utilities or Real Estate sectors would be up nearly 12% in a market that fell over that time period.
Long-short strategies are an area of increasing interest for us precisely because the returns of such strategies don’t move in lockstep to the returns of the broader market. Stay tuned here and at Young’s World Money Forecast for more on our long/short strategies.

