The initial estimate for first quarter GDP came in at 2.5% which fell short of the 3% projected by economists. When people used to talk about trend GDP it meant 3.5%, then 3%, and now, it’s looking like something else altogether.
[expand title=”Click here to read more.”]
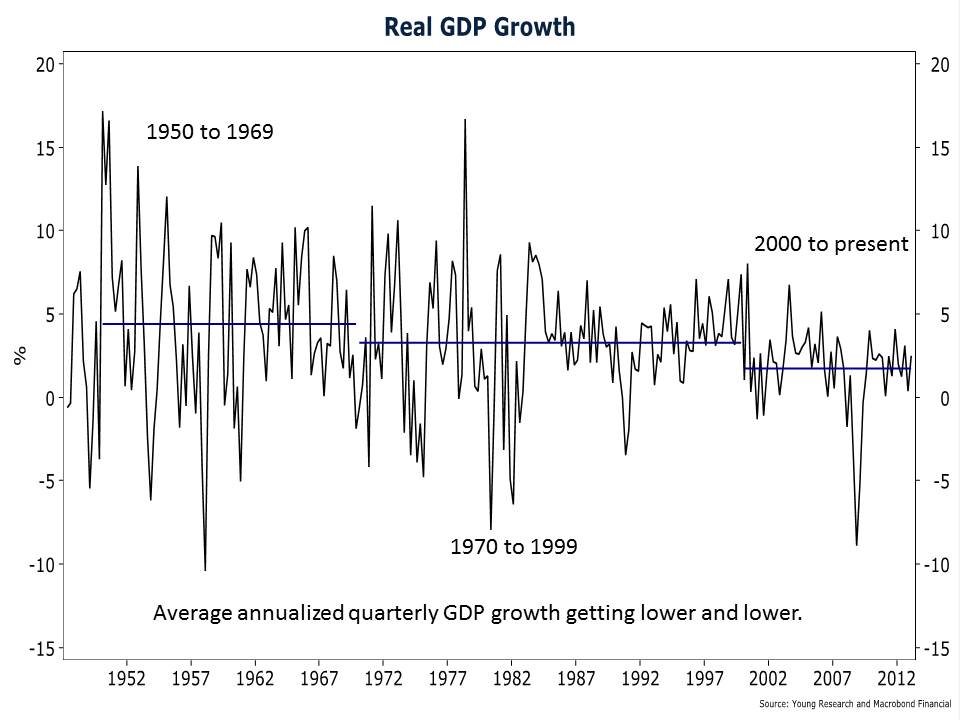
From 1950 to 1969 the annualized rate of quarterly real GDP growth averaged 4.4%. In the post-gold standard/pre-internet years from 1970 to 1999 the average was about 3.3%. But since 2000, the average has dropped significantly, to 1.73%.
The question is, is this the new normal, and if not, what will get this economy moving at previous speeds? There isn’t a lot of growth in the various sectors of the economy. Overall spending accounted for 2.24% of the 2.5% increase in GDP. Personal consumption rose at a 3.2% annual rate—the fastest rate of growth since the first quarter of 2011. Given the increase in payroll taxes and very low savings levels, consumption seems at risk.
If growth slows from here, which the most recent data point to, we may be approaching stall speed in the next quarter or two, but then again that may all get revised away as the BEA is doing a comprehensive revision to GDP with the July release. They will be adding new and subjective categories to GDP that haven’t been present in the past. Odds are the revisions will make growth look better than has been reported.
[/expand]


