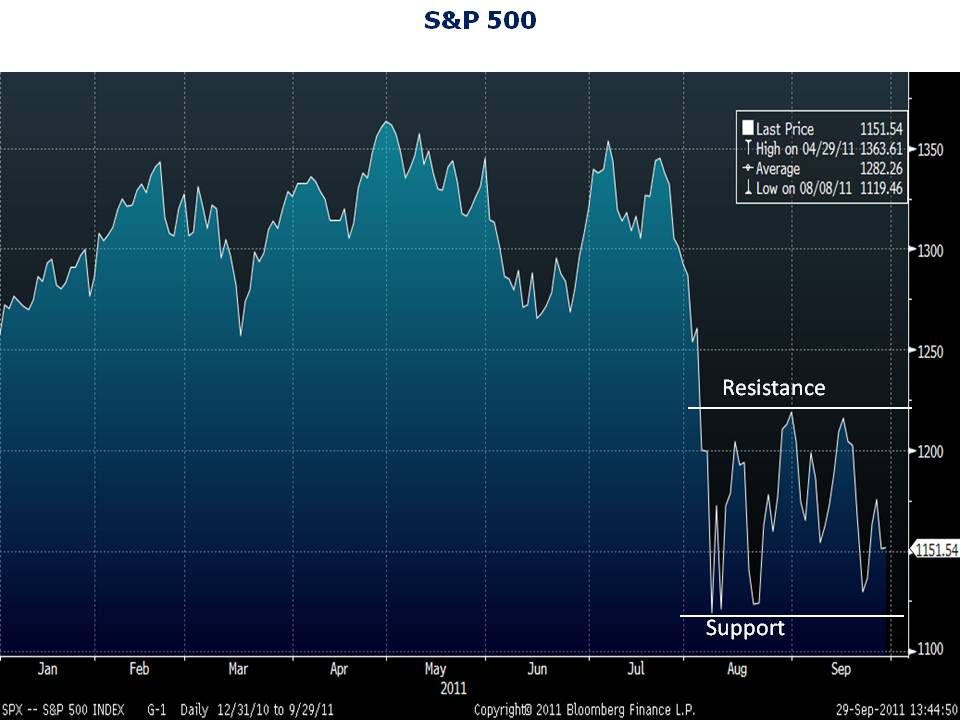
After busting through its previous support level of 1,200, the S&P 500 dropped to an intraday low of 1,100 in early August. As we pointed out in our last technical analysis update, longer-term charts show that stocks have significant support in the 1,100-1,150 range. That support level has been confirmed by the price action over the last six weeks. The S&P 500 has tested, let’s call it, 1,125 on four occasions over recent weeks. Each time, the market hit 1,125 it bounced higher. But the rallies have failed each time the index approached 1,225. Stocks have carved out a 100 point range between S&P 1,125 and S&P 1,225. A break below 1,125 on the index would likely signal another 5-10% of downside while a break above 1,225 would signal further gains. The key levels to watch are 1,125 and 1,225.
You Might Also Like:
Jeremy Jones, CFA, CFP® is the Director of Research at Young Research & Publishing Inc., and the Chief Investment Officer at Richard C. Young & Co., Ltd. CNBC has ranked Richard C. Young & Co., Ltd. as one of the Top 100 Financial Advisors in the nation (2019-2022) Disclosure. Jeremy is also a contributing editor of youngresearch.com.
Latest posts by Jeremy Jones, CFA (see all)
- Money Market Assets Hit Record High: $5.4 Trillion - May 26, 2023
- The Mania in AI Stocks Has Arrived - May 25, 2023
- The Wisdom of Sam Zell - May 24, 2023

