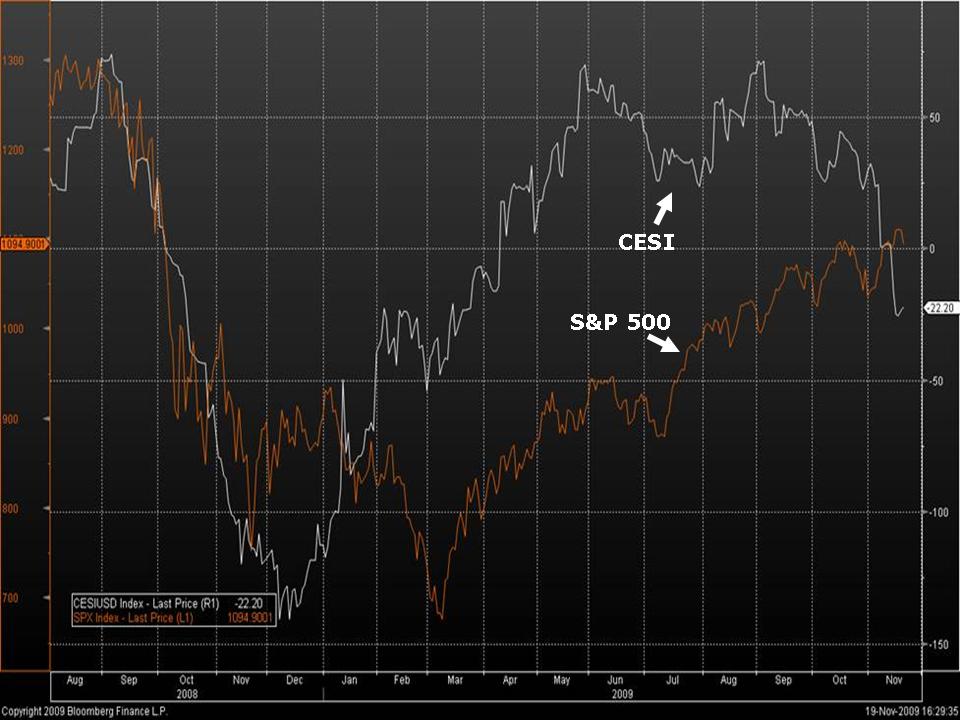
The Citigroup Economic Surprise Index (CESI) accurately forecasted a 60%-plus rally in the stock market in early 2009. The CESI is an indicator designed to measure whether economic data is coming in better or worse than the average analyst’s expectations. A rising index indicates that economic data is coming in better than expected, whereas a falling index indicates that economic data is coming in worse than expected. The theory is that the consensus expectations for economic data are priced into the market. So then, when new economic data turns out to be better than the market’s expectations, the market should rise to reflect a better-than-expected economic environment.
My chart shows that the CESI led a recovery in the S&P 500 by approximately three months. In October, CESI started breaking down, but the S&P 500 has continued to climb. A continuation of the decline in the CESI may indicate that stocks are poised for a correction. This indicator should be watched closely over coming weeks and months.

