The bull market in stocks passed the two-year mark this week. From its low on March 9, 2009, the S&P 500 is up 100%—the fastest 100% gain since the 1930s. On a total-return basis, the S&P 500 is still 9% below its all-time high, but the index has just about recovered all of its losses since year-end 2007.
How has your portfolio performed since year-end 2007? Are you back to even, or did the extreme volatility in stocks get the better of you? Having recently updated the performance data for Young Research’s Global Investment Strategy (GIS), I thought you may be interested to learn how our recommendations have performed over the last three tumultuous years.
If you aren’t familiar with Global Investment Strategy, it is Young Research’s premium strategy report. In GIS we cover the global economic and monetary landscape. We provide recommendations on domestic and international stocks, commodities, currencies, and fixed income, including individual bonds as well as special situations such as distressed securities and long-short trades.
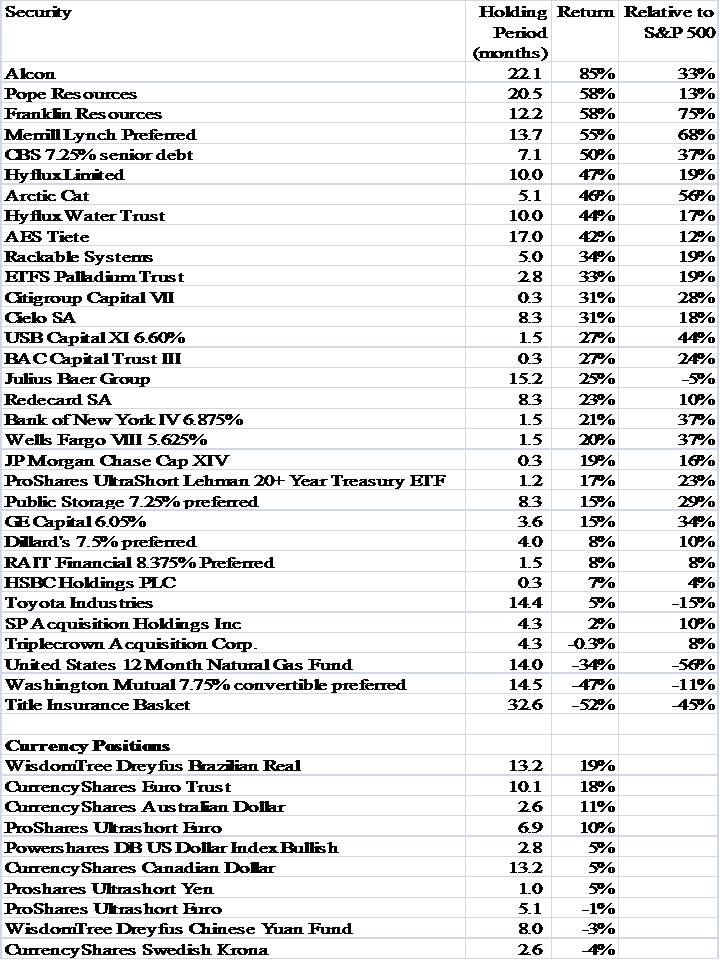
The table below includes all of the closed recommendations that we made since year-end 2007. The table includes the security, the holding period in months, and the return. Though we don’t spend much time trying to outperform a benchmark at Young Research, for those of you who are interested in such comparisons, I’ve also included the performance of each recommendation relative to the S&P 500.
Since year-end 2007, we’ve recommended and closed 32 stock or commodity positions. Of the 32, 28 have been profitable and 27 have outperformed the S&P 500. That’s an .875 batting average. Our currency recommendations have also performed well. Since we started covering currencies in GIS, we’ve closed 10 positions—seven were winners, and three were losers. That’s a .700 batting average. Our average gain is 6.4%, with an average holding period of about six months. That works out to an annualized gain of over 13%—with no stock-market risk.
I of course can’t offer you a similar table for our open positions, but I can tell you that we are sitting on gains of 109%, 81%, 69%, 68%, 62%, 58%, 56%, 47%, 37%, 34%, 22%, 19%, 15%, 14%, 13%, 10%, 9%, 9%, 8%, 5%, 4%, 2%, -3%, -14%, and -44%. That’s a .880 batting average, for those of you still keeping score.
If you want help crafting a globally diversified portfolio of stocks, bonds, commodities, and currencies, please join us.