For as long as the economy has been crawling its way out of the last recession, economists and policymakers have been puzzled by the lackluster rate of economic growth. In past economic cycles, deeper recessions were usually followed by stronger recoveries. Coming out of prior recessions, growth rates of 4%, 5%, and even 7% were not uncommon. During this cycle, annual GDP growth hasn’t broken 3.25% once.
What explains the lackluster growth during this cycle?
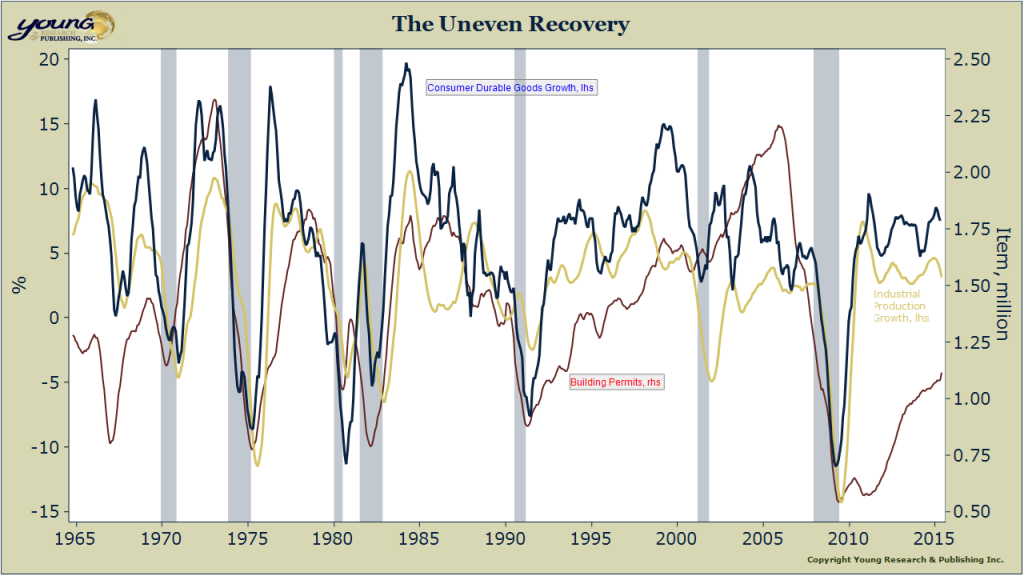
Aside from the many policy missteps that have held back growth, the chart below explains why the economy still hasn’t hit its stride six years into a recovery and probably won’t before the next recession hits.
What you are looking at is the smoothed growth rate of consumer durable goods and industrial production along with the smoothed level of building permits (a non-trending series). All three are among the most cyclical sectors of the economy. If you examine the chart closely you will notice that in past recoveries all three series rose sharply coming out of recession. When all of the cyclical cylinders of the economy are firing at once you get a big bounce in GDP growth.
This cycle has been different. Consumer durables and industrial production recovered quickly following the recession, but the housing sector languished. That held back growth in the early stages of the recovery. And now, just as housing is finally showing some strength, industrial production growth is rolling over and consumer durables growth has likely peaked for the cycle.
The staggered recovery in the cyclical sectors of economy has and will likely continue to constrain the maximum rate of GDP growth for the duration of the cycle. Those economists and policymakers hoping for a sustained burst of GDP growth may be disappointed.

