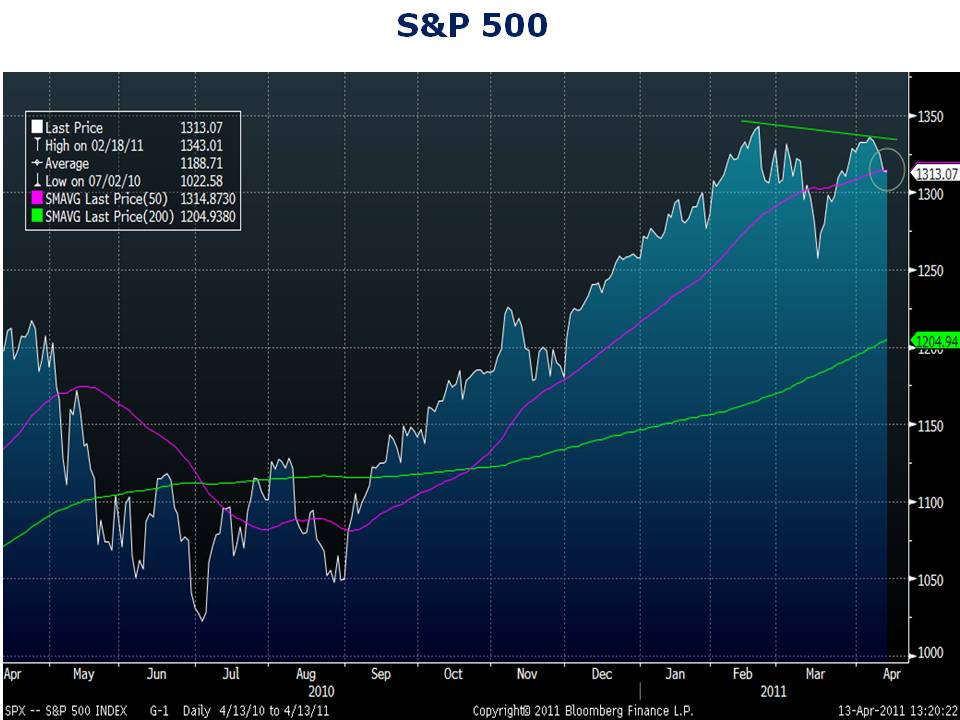
The S&P 500 is at a key technical level. The bounce-back rally from the March low has failed to surpass the February 18th high. The index is forming a double top, and looks poised to break below its 50-day moving average. A close decidedly below the 50-day average could result in a more extended correction. How big of a correction? On a technical basis, there is minor support for stocks at 1,250 and again around 1,200, but I don’t see meaningful support for stocks until the S&P approaches the 1,100 level—that’s a long ways down from today’s level of 1,312.
Jeremy Jones, CFA, CFP® is the Director of Research at Young Research & Publishing Inc., and the Chief Investment Officer at Richard C. Young & Co., Ltd. CNBC has ranked Richard C. Young & Co., Ltd. as one of the Top 100 Financial Advisors in the nation (2019-2022) Disclosure. Jeremy is also a contributing editor of youngresearch.com.
Latest posts by Jeremy Jones, CFA (see all)
- Money Market Assets Hit Record High: $5.4 Trillion - May 26, 2023
- The Mania in AI Stocks Has Arrived - May 25, 2023
- The Wisdom of Sam Zell - May 24, 2023

