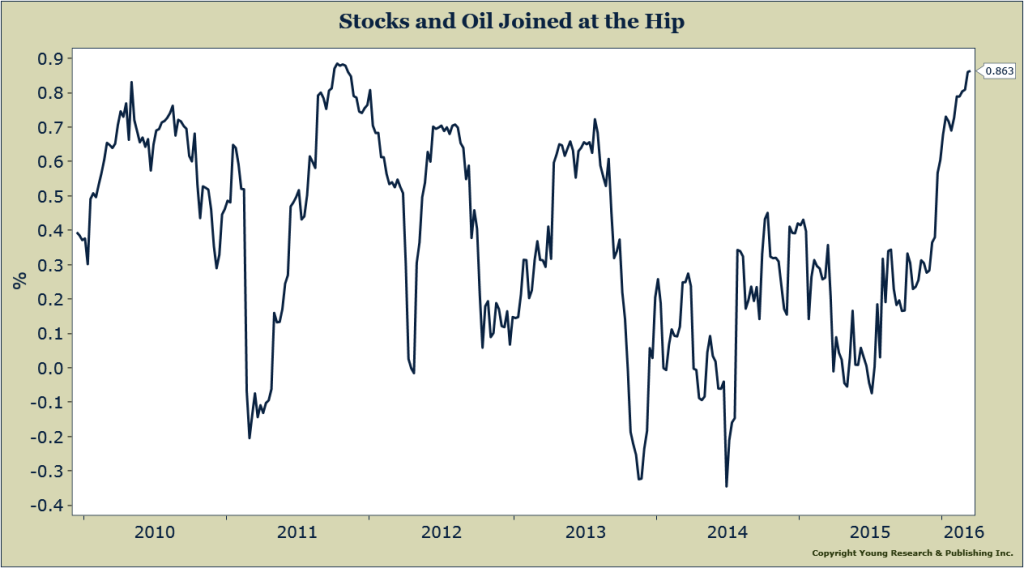
As goes oil, so goes the stock market. At least that has been a dominant theme so far in 2016. The chart below shows the rolling 16-week correlation between weekly changes in the S&P 500 and WTI crude futures. The correlation between oil and stocks soared in 2016. On days when oil was up big, chances are stocks were up as well. And when oil tanked, you can bet that stocks were down that day. Why this relationship has grown so tight this year is not obvious. Lower oil prices are still a net benefit to the consumer and the consumer economy. But this chart points us toward the profound conclusion that the stock market is not the consumer. Well, profound for a holiday.
Where do stocks go from here? Oil prices might offer as good a clue as anything.