
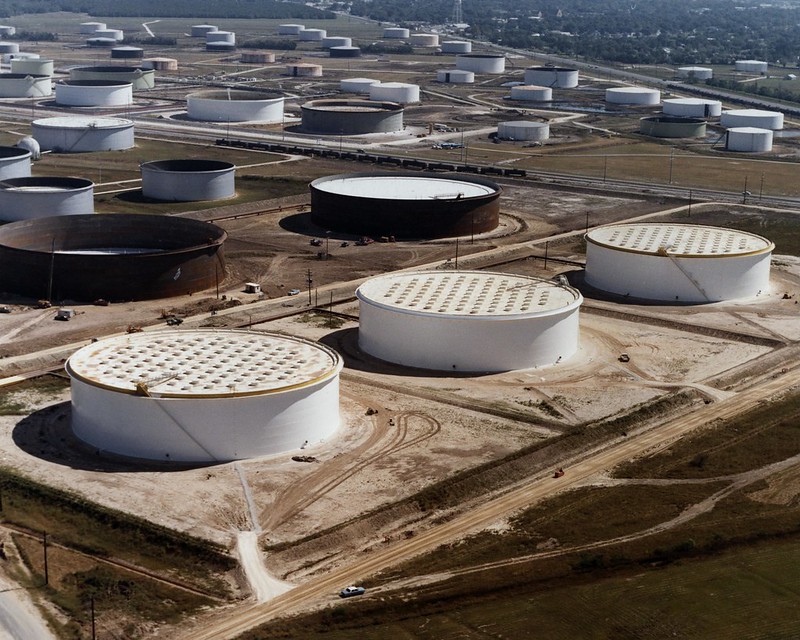
AERIAL VIEW OF THREE (WHITE) DOE CRUDE OIL STORAGE TANKS IN THE FOREGROUND AT THE SUNOCO TERMINAL NEAR NEDERLAND, TX. THE PURPOSE OF THE STRATEGIC PETROLEUM RESERVES IS TO REDUCE THE NATION’S VULNERABILITY TO A SEVERE SHORTAGE OF PETROLEUM SUPPLY. THE SITES NEED TO BE ACCESSIBLE TO TANKERS AND PIPELINES SO THAT, IN AN EMERGENCY, THE OIL COULD BE WITHDRAWN AND ENTERED INTO THE NORMAL DISTRIBUTION SYSTEM. THE GULF COAST HAS THE PORTS, REFINERIES, AND PIPELINES TO ACCOMMODATE THE RESERVES. THE STORAGE AREAS ARE BEING CONSTRUCTED UNDERGROUND IN SALT DOMES ALONG THE TEXAS AND LOUISIANA COASTS. DOE photo. September 3, 2014.
At The Wall Street Journal, James Mackintosh suggests that the strong performance of the energy sector is making the stock market look better than it should. He writes:
Soaring profits at oil companies and miners are making earnings look better than the reality of the rest of the stock market, and distorting Wall Street’s favorite valuation tool, the ratio of price to forecast earnings.
Strip out the energy sector and the expected rise in earnings for the S&P 500 this year drops from 8% to just over 1%, according to data from Refinitiv’s IBES. Strip out miners and other commodity players, too, and earnings for the rest of the market are now expected to fall this year.
Earnings Growth Is All About OilStrip out the energy sector and this year’s earnings forecasts have collapsed—but next year profits areexpected to grow strongly.
The same goes for valuations: The S&P 500 is priced at 18 times this year’s expected earnings—hardly a bargain but at least cheaper than the 22 times that prevailed at the start of the year. Take out energy and commodities stocks, though, and the valuation jumps back up to 20 times this year’s EPS, according to Citigroup data—suggesting even less hope for those searching for cheap American stocks.
What’s surprising is that such a tiny sector—energy made up only 2.7% of the S&P by value at the start of the year, and other commodities stocks even less—should be having such a big effect.
There are two reasons. The first is simple: Soaring oil prices have pushed up the energy sector to be 4.8% of the S&P by value, making it matter more. The second is more intriguing, and goes to the heart of the question of how to use stock valuations: Oil stocks are by far the cheapest part of the market on price-to-earnings ratios. That means energy-sector earnings make up a far larger proportion of S&P 500 profits—more than a 10th—than their market weight suggests.
And when I say cheap, I mean it. The energy sector trades at just 8 times expected earnings for the next 12 months, and Marathon Oil at just six times. These are valuations usually associated with dying companies, not firms making record profits.
By contrast Amazon is at 80 times and Tesla 56 times, the sort of super-stretched valuations that can only be justified by fabulous growth prospects.
Yet, the oil valuations make perfect sense, because they are almost the inverse of Amazon and Tesla: Profits are at their highest ever now but expected to decline in years to come as the elevated oil price drops. The price of benchmark West Texas Intermediate oil futures gets lower the further out they mature, from $86 for the closest contract until it stabilizes at $57 in 2030.
Windfall oil profits are welcome to shareholders, but because few believe they will stay high, investors apply only a low multiple to them.
Such oddities are a reminder to investors that valuation tools are merely tools, not a perfect guide to future returns. Oil stocks might look cheap on the PE ratio, but only because the ratio looks just one year ahead at what are almost certainly temporarily high earnings—further out, the PE ratio is less attractive. It is the inverse of what happened in 2020, when depressed (briefly negative!) oil prices meant the sector traded at very high multiples of then-very-low earnings, something that didn’t indicate that oil stocks were expensive.
Read more here.