Four Percent! Can you believe it?
The first estimate of second quarter GDP growth was released this week and it came in at a piping hot 4%. That is the third highest quarterly growth rate since the recovery began and only the seventh time in the last 56 quarters that growth has been so high.
But before you start celebrating, I should note that the 4% growth rate comes with an asterisks. Much of the growth in the second quarter was simply catch up from an especially weak first quarter. After revisions, the Bureau of Economic Analysis said GDP in the first quarter contracted at an annual rate of 2.1%. That puts growth across the first half of the year at about 0.90%.
Is the economy really only growing at a 0.90% annual rate? It sure feels stronger than that. I can tell you that Newport, RI is the busiest I have seen it in years. Yes, that’s anecdotal, but much of the higher frequency economic data is also consistent with an economy that is growing closer to 4% than 0.90%.
The key question for investors like you and me though, is not what the current run-rate of growth is, but whether or not strong growth can be sustained.
Investment Implications
This is not just an academic question. It matters for your bond portfolio and your stock portfolio. If growth sustains at 4% through the rest of the year, the Fed may be forced to hike rates faster than many investors expect. If your fixed income portfolio isn’t positioned for such a scenario, higher interest rates will sting. The same is true in the stock market. With bond yields in the tank, many investors have been purchasing stocks to earn additional income. If interest rates rise and these investors move aggressively back into bonds, the stock market could suffer.
So what is the verdict? Is a 4% rate of growth sustainable? My crystal ball is no better than the next guy’s. Most of the economic data I see on the economy points toward continued growth. But you could learn that by reading the morning newspaper or, if you can stomach it, by turning on CNBC for a few minutes.
What you don’t often hear from the mainstream financial press are the clues that assets markets are sending about the economy. It is these subtle clues that can help you spot trouble early or identify opportunity before the crowd.
The Luxury Goods Indicator
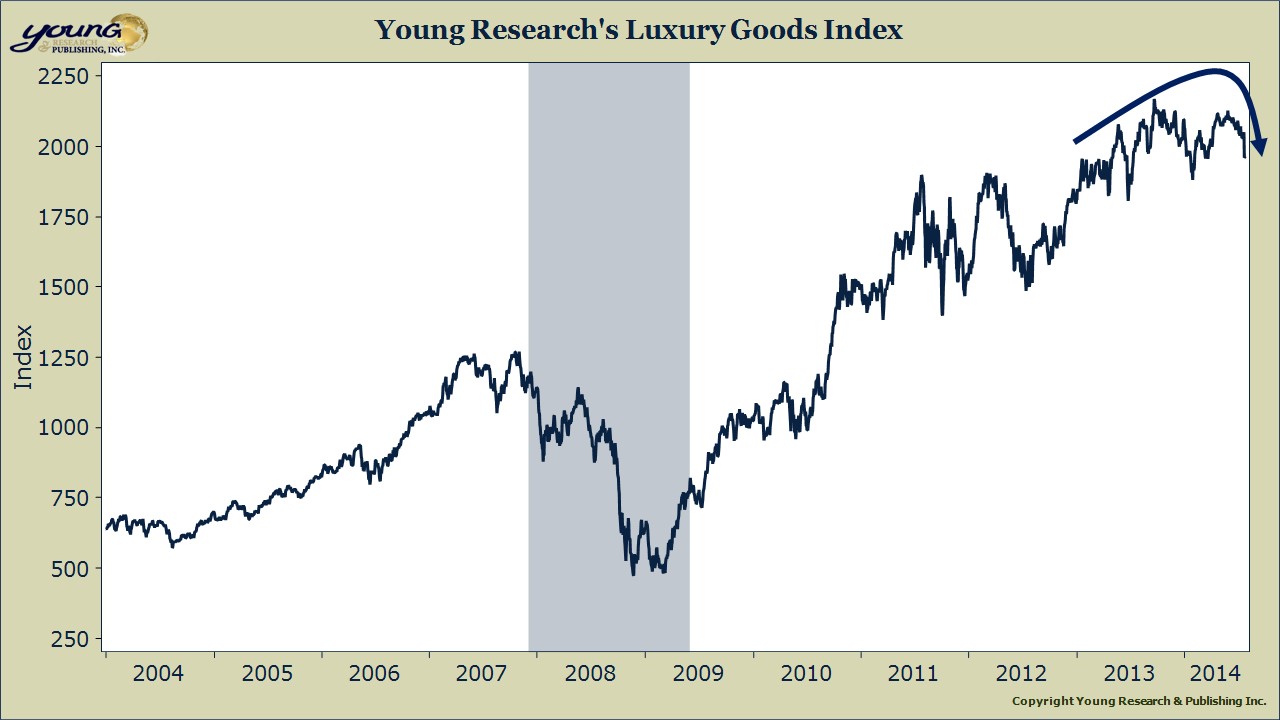
What are asset markets saying about the economy today? There are many useful nuggets of economic data that can be coaxed from the financial markets. But what I would like to focus on is the signal that Young Research’s Luxury Goods Index is sending.
Young Research’s Luxury Goods Index is a modified market-cap weighted index of some of the world’s most prestigious luxury brands. You would recognize many of the names in the index. The components include Tiffany’s, Louis Vuitton, Hermes, Bulgari, and Southeby’s among others. No single stock accounts for more than 20% of the index. Our luxury goods index provides a real-time snapshot of the health of the high-end consumer.
Why should you care about the health of the high-end consumer?
The 40/5 Rule
Over recent decades, the high-end consumer has become vital to both U.S. and global economic growth. In 2012, the top 5% of earners were responsible for almost 40% of U.S. consumption. That is up from 27% in 1992. Consumption accounts for about 70% of GDP so the top 5% of income earners affect about 28% of GDP.
If high-end consumers go on a spending spree they are likely to drag the rest of the economy along with them. And if high-end consumers tighten up their wallets, economic growth is likely to suffer.
So when I see a chart of Young Research’s Luxury Goods Index like the one below that looks like it is rolling over, I get concerned. If the Luxury Goods Index is signaling a slow-down in high-end consumer spending, I have a hard time believing that the current rate of economic momentum can be maintained. We aren’t yet at panic levels. Luxury goods stocks may just be going through a routine correction, but this is a development that bears watching.